A lot of geographic data already exists to create maps, but it can be in many different formats, and finding it is not always easy.
Geographic coordinate systems, describing positions on the surface of the Earth in latitude and longitude, are the most common representation of spatial data.
 Since the time of the Ancient Greeks it has been known that the Earth was a spherical object rather than a flat surface. Since the time of the Ancient Greeks it has been known that the Earth was a spherical object rather than a flat surface.
Though it was suggested millennia ago that the Earth rotates once a day, this fact was not widely accepted until the 17th century, and was not firmly established until the 19th century.
The Earth's rotation defines certain reference points and circles that we can use to determine our position on its surface.
The Earth's rotation axis is a line that passes through the the North Pole, the South Pole, and the center of the Earth.
The Equator is a circle on the Earth's surface that's perpendicular to its axis and equidistant from its poles:

The reference points described above establish the four Cardinal Directions.
The direction toward the North Pole is North, and South is in the opposite direction, toward the South Pole.
The direction parallel to the Equator and toward the Earth's rotation is East, while the direction opposite to the Earth's rotation is West.
By definition, North and South will always be at right angles to East and West, at any point on the surface of the Earth.
In addition, the direction toward or away from the Earth's Center are, of course, down and up, respectively.
It is useful and important to be able to precisely specify positions on the Earth's surface: to compare positions, calculate distances, and in general navigate from one point to another.
So, a pair of numbers or geographic coordinates are used that are similar to the x and y Cartesian coordinates in a plane, but designed for a sphere.
These two numbers, latitude and longitude, are angles measuring south-to-north and west-to-east, respectively.
 Any circle parallel to the Equator is called a parallel of latitude. Any circle parallel to the Equator is called a parallel of latitude.
The angle (with vertex at the center of the Earth) between a given parallel of latitude and the Equator describes that parallel and any point on it, and is called the latitude.
So, the North Pole is at 90° north latitude, the Equator itself is 0° latitude, and the South Pole is 90° south latitude.
Amherst is located at 42.37° north latitude.
Southern latitudes are often expressed as negative values, particularly in computer applications such as GIS.
One degree of latitude corresponds to a distance of 111 Km (69 miles) across the Earth's surface.
 Any semicircle passing through the poles is called a meridian of longitude. Any semicircle passing through the poles is called a meridian of longitude.
One of these is designated as the Prime Meridian, namely the one passing through the Royal Observatory in Greenwich, England (just outside London).
The angle (with vertex at the center of the Earth) along the Equator between a given meridian and the Prime Meridian describes that meridian and any point on it.
So Amherst is located at 72.52° west longitude.
Western longitudes are often expressed as negative values, particularly in computer applications such as GIS.
Note that 180° west longitude is the same meridian as 180° east longitude.
One degree of longitude at the Equator also corresponds to 111 Km; but this gets progressively smaller as one moves towards the poles, eventually shrinking to zero (varying as the cosine of latitude).
Because a degree of latitude or longitude is relatively large, a common practice is to break them down into smaller units.
A minute of arc is defined to be 1/60 of a degree, often abbreviated as a single prime (').
A minute of arc corresponds to 1.86 Km = 1.15 miles (called a "nautical mile").
A second of arc is defined to be 1/60 of a minute of arc, often abbreviated as a double prime ('').
A second of arc corresponds to 31.0 m = 101 feet.
The location of Amherst Center can therefore be given more accurately as 42° 22' 31'' N. Latitude, 072° 31' 11'' W. Longitude.
 In the seventeenth century, Isaac Newton suggested that, because the Earth is rotating and not perfectly rigid, it will bulge slightly at its equator. In the seventeenth century, Isaac Newton suggested that, because the Earth is rotating and not perfectly rigid, it will bulge slightly at its equator.
So, the Earth is not precisely spherical, but instead is an oblate ellipsoid, like a squashed beachball.
Precise measurements put the equatorial and polar diameters of the Earth at 12,756 Km and 12,713 Km, respectively, a difference of only 43 Km (0.34%).
This small oblateness can still effect the positioning of maps, so it must be taken into account.
In addition, the Earth has substantial variations in the elevation of its surface from point to point:
- The peak of Mt. Everest is 9 Km above sea level.
- The deepest point of the Marianna Trench is 11 Km below sea level.
 (4) (4)
Because the Earth's surface is so rough, fitting it in the best way with an ellipsoid depends on where you want to map it!
A datum is a choice of ellipsoid to model the Earth's surface, viz. the location of its center, its size, and its orientation.
Many datums have been defined; U.S. maps commonly use the North American Datum of 1927 (NAD27), and more recently, NAD83.
With the expansion of international travel and commerce, worldwide standards have been adopted, such as the Geodetic Reference System of 1980 (GRS 1980) and the World Geodetic System of 1984 (WGS84).
Note that this means that a measurement of latitude and longitude will depend on which datum you use!
You should therefore always ascertain the datum when you've been given geographic data (NAD83 for Amherst, above).
The datum is the foundation of a geographic data set's spatial reference; let's look at an example:
- In
 ArcMap, in the Table of Contents, double-click on the layer of interest, e.g. ArcMap, in the Table of Contents, double-click on the layer of interest, e.g.  countries. countries.
- In the dialog Layer Properties, click on the tab Source.
- Read the text field Data Source. You should see both the datum listed as well as the geographic coordinate system.
To view the Earth on a flat piece of paper or a computer screen, its curved surface must be projected.
 Once a datum has been chosen as a model of the Earth, it is straightforward to reproduce its features on a globe. Once a datum has been chosen as a model of the Earth, it is straightforward to reproduce its features on a globe.
For many purposes it's much more useful to represent the Earth on a flat surface, such as paper or a computer screen.
Such a flattened representation of the Earth is called a map.
The flattening process is known as a projection.
Map projections are similar to other projections you may be familiar with, such as projecting a slide or transparency onto a screen.
There are three common, general ways to "flatten" the Earth: Planar, Conic, and Cylindrical:
- Planar Projection: hold a plane surface up to the Earth, as shown to the right.
This type of projection is commonly used to represent the Earth as a globe.
- Conic Projection: wrap a cone around the Earth:
 (1) (1)
then cut it along one side and flatten it:
 (1) (1)
- Cylindrical Projection: wrap a cylinder around the Earth:
 (1) (1)
and again cut it along one side and flatten it:
 (1) (1)
These surfaces can be tangent to the Earth's surface (touching it along one standard point or standard curve), as in all of the images above, or secant to it (intersecting at one or two standard curves), as in the following images:

For each of these surfaces, there are a number of different ways to project the Earth's features onto them.
 Any projection will necessarily distort some aspect of geography: Any projection will necessarily distort some aspect of geography:
- distance: all projections distort distance in some way.
- shape: some projections can preserve angles and therefore small shapes, and are said to be conformal.
- area: some projections can preserve relative area, and are called equal-area.
Warning: No projection can be both conformal and equal-area.
A famous example is the Mercator projection (right (1)), a conformal coaxial cylindrical projection that makes navigation easier but severely distorts area near the poles.
Another common example is the Plate Carrée projection (below), also a coaxial cylindrical projection that preserves (longitude, latitude) by simply mapping it to (x, y); however, it is neither conformal nor equal-area (though it is equidistant north-south).
Question: When bringing in data defined only in terms of geographic coordinates, ArcMap uses a default projection. Can you tell what it is?
 Any distortion introduced by a projection will be smallest at the standard points or curves where the projection surface touches the Earth's surface. Any distortion introduced by a projection will be smallest at the standard points or curves where the projection surface touches the Earth's surface.
Non-global maps will therefore generally use a projection that minimizes distortion near the region of interest.
If the map will cover a relatively wide area, secant projections are generally used, since they even out the distortion around the multiple standard curves.
Regions that are elongated east-west are commonly represented by coaxial conic projections (touching along parallels):
- Lambert Conformal Conic (right (1))
- Albers Equal-Area Conic (below, standard parallel = 45°)
Regions that are elongated north-south are commonly represented by transverse cylindrical projections (touching along meridians), e.g. the Transverse Mercator projection (below).
(What's that on the left side?)
A large number of different projections can displayed with Penn State's Interactive Album of Map Projections.
Once the Earth is flattened, its often easiest to use planar coordinates to describe it.
 A map projection, being flat, will often be given its own set of Cartesian map coordinates. A map projection, being flat, will often be given its own set of Cartesian map coordinates.
The origin is generally chosen to be far west and south of the region of interest.
Both coordinates (x, y) then increase towards the east and north, and are therefore always positive numbers.
(x, y) are known as the easting and northing, respectively.
The origin is typically defined by the false easting and false northing, which are the map coordinates of the standard points or curves that define the projection.
Map coordinates are generally measured in linear units such as feet or meters.
State Plane Coordinates are defined by each individual state to provide a highly accurate (< 0.01%) system of mapping for surveying, etc.
Current State Plane Coordinates are based on the NAD83 datum and two conformal secant projections, Lambert Conic or Transverse Mercator, and use units of meters.
 (4) (4)
The low distortion requires state plane maps to be no more than 158 mi across, so most states use more than one projection to cover their area, breaking at county boundaries.
Massachusetts State Plane Coordinates are based on two Lambert Conic projections, one for the Mainland Zone (most of the state) and the other for the Island Zone (Dukes and Nantucket Counties — the Elizabeth Islands and Martha's Vineyard, and Nantucket Island):
 (2) (2)
The Universal Transverse Mercator system provides a uniform way to describe any non-polar location on the Earth with good accuracy (< 0.08%).
The Earth is divided into sixty narrow north-south strips, each six degrees of longitude wide and extending from 80° S. Latitude to 84° N. Latitude:
 The zones are numbered from west to east, starting with 1 from 180° W. Longitude, and are individually mapped with a transverse mercator projection centered on the zone. The zones are numbered from west to east, starting with 1 from 180° W. Longitude, and are individually mapped with a transverse mercator projection centered on the zone.
The central meridian of each zone is assigned a false easting of 500,000 meters, and the Equator is assigned a false northing of zero meters in the northern hemisphere, and 10,000,000 meters in the southern hemisphere.
Massachusetts is covered by Zones 18 and 19 (3).
GIS makes it easy to combine maps with different projections and display them with any spatial reference you prefer.
To accurately represent mapped data on a computer screen, and to ensure that it can successfully be used with other data, it must have a spatial reference defined for it, which includes a datum, possibly a projection, and a coordinate system.
The spatial reference determines how the map's positions should be interpreted for display on the screen.
Sometimes the spatial reference is described in a standard format with the data, and is said to be a part of its metadata (data about data).
At other times the spatial reference must be manually assigned.
In order to simultaneously display two or more sets of GIS data with different spatial references, some of them must be recast to a common spatial reference.
Because each spatial reference is based on a particular datum and possibly also a projection, switching spatial references can involve a complicated mathematical process:

Switching datums is generally more prone to error than simply unprojecting and reprojecting.
ArcGIS has full support for multiple spatial references, and will automatically reproject data sets so that they are all displayed with the same reference.
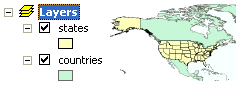
Data layers are grouped together in a data frame, by default called  Layers: Layers:
If you click once on the name of a data frame, you can change it to something else, e.g. Map Data.
Each data frame has its own spatial reference that is used to display its layers in the Map Display pane.
ArcMap can have multiple data frames defined in its Table of Contents, but only one of them can be displayed at a time (but note that layouts can include inset maps from other frames).
The current data frame's spatial reference determines how all of its layers are displayed in ArcMap. To determine what it is:
- In ArcMap, in the Table of Contents, double-click on the frame of interest, e.g. Layers.
- In the dialog Data Frame Properties, click on the tab Coordinate System.
- Read the text field Current Coordinate System:.
A data frame's coordinate system is initially determined by the first layer added to it. In the example above this was the countries.shp layer.
The way your map is displayed, i.e. the spatial reference of its data frame, can be altered through the same dialog:
- In ArcMap, in the Table of Contents, double-click on the frame of interest, e.g. Layers.
- In the dialog Data Frame Properties, click on the tab Coordinate System.
- In the list Select a Coordinate System:, navigate through the various possibilties:
- Predefined lists a large collection of
If a layer's coordinate system isn't self-described, ArcMap assumes it is the same as that of the frame.
For example, see what happens when you add the layer masscounties.
In this case ArcMap says the layer "cannot be projected" and uses its position data as if it were intended for the current frame's projection:
More often than not, however, this isn't what you want, and you'll need to assign a coordinate system manually!
To assign or alter the coordinate system of a layer, you must use the  ArcCatalog software, which is designed for the management of individual layers:
 (1) double-click on the layer; (1) double-click on the layer;
(2) click on the tab Fields;
(3) click on the field Shape;
(4) in the field property Spatial Reference, click on the button ... ;
(5) click on the button Select...;
(6) browse for a coordinate system;
(7) click on the buttons Add, OK, and OK.
An alternative is to choose a coordinate system from another layer:
(5') click on the button Import;
(6') browse for a layer;
(7') click on the buttons Add, OK, and OK.
To find locations and distances on a map, you can use the map coordinates provided by the current spatial reference. You may have already noticed that, in the lower right corner of the screen, there are a pair of numbers. They show the location of the cursor on the map in the current map coordinates. In this case their unit is meters. These numbers will change as you move the cursor over the map.
Question: Where on the map are the coordinates near zero?
It's sometimes useful to change the displayed units; this is controlled by the data frame that holds your layers (like a folder holds files). By default it's simply called Layers and can be seen at the top of the Table of Contents .
- In ArcMap , double-click on Layers .
- The dialog Data Frame Properties will now appear. Click on the tab General .
- In the area Units , in the menu Display , choose Miles .
- Click on the button OK .
The display units will now be miles.
Before beginning the exercises, make sure that you have copied the folders makingmaps and findingdata from K:\Maps to C:\Maps.
- Investigate the effects of changing a map's coordinate system:
a. Open the ArcMap software;
b. Select A new empty map and then click on the button OK;
c. Click on  Add Data Add Data (browse if necessary);
c. Compare the coordinate system for the frame to that of the elevation layer;
d. Change the coordinate system for the frame to something in Predefined > Geographic, and note how the display changes;
e. Does the coordinate system of the elevation layer change?
- Investigate the effects of adding layers to a map:
a. Click on Add Data and open C:\Maps\makingmaps\exercises\states\states.shp;
b. Compare the coordinate system of the states layer to that of the frame and to that of the elevation layer;
c. Change the coordinate system for the frame to Predefined > Projected > World > Mercator, and note how the display changes.
- Investigate adding a layer with an undefined coordinate system:
a. Turn off the elevation layer;
b. Click on Add Data and open C:\Maps\findingdata\masscounties\cntysp1.shp;
c. Click on  Full Extent Full Extent
d. Find the Massachusettts counties; why are they in that location?
e. Right-click on cntysp1 and select Remove;
f. Open the ArcCatalog software;
g. Locate C:\Maps\findingdata\masscounties\cntysp1.shp;
h. Change the coordinate system of the cntysp1 layer to Predefined > Projected > State Plane > NAD 1983 > NAD 1983 StatePlane Massachusetts Mainland;
i. Drag cntysp1.shp from ArcCatalog to ArcMap, making sure it's at the top of the frame;
j. Right-click on cntysp1 and select Zoom To Layer;
k. How do the Massachusettts counties look now?
l. If you have time, you might investigate the effect of using NAD 1983 (feet) instead of NAD 1983, which is in meters.
- Map Projection, Eric Weisstein's World of Mathematics, Weisstein, Eric W., http://mathworld.wolfram.com/MapProjection.html.
- MassGIS, Office of Geographic and Environmental Information, Commonwealth of Massachusetts Executive Office of Environmental Affairs, http://www.state.ma.us/mgis/massgis.htm.
- The Universal Transverse Mercator (UTM) Grid, United States Geological Survey, http://erg.usgs.gov/isb/pubs/factsheets/fs07701.html.
- The State Plane Coordinate System of 1983, James E. Stern, National Oceanic and Atmospheric Administration, http://www.ngs.noaa.gov/PUBS_LIB/ManualNOSNGS5.pdf.
- Images: Visualizing Data, National Geophysical Data Center, http://www.ngdc.noaa.gov/mgg/image/images.html#relief.
- Map Projections, U.S. Geological Survey, http://erg.usgs.gov/isb/pubs/MapProjections/projections.html.
Geographic data shows up in a wide variety of formats.
ArcGIS understands a large number of raster formats, including most common image formats.
Raster files often have an associated world file, which describes their positioning in some coordinate system.
Make sure you have both files, or you'll have to georeference the image!
- bmp - Windows bitmap
bpw - World file for BMP images
- dem - Digital Elevation Model file
- ecw - Enhanced Compressed Wavelet
This is a proprietary format from Earth Resource Mapping, Inc.; ArcGIS requires a free plugin to view it.
In this format the image is compressed with wavelet technology, from which different resolutions can be extracted as needed for fast screen display.
Wavelet compression is "lossy" to obtain very small files, i.e. it throws away some information that it thinks it can reconstruct.
- gif - Graphics Interchange Format image file
gfw - World file for GIF image
This compressed image format is commonly used on the Internet for images with simple colors and structures, e.g. line drawings.
- jpg - Joint Photographic Experts Group
jpw - World file for JPEG image
This image format is commonly used on the Internet for photographs and other images with many gradations of color.
It uses "lossy" compression to obtain very small files.
- jp2 - Joint Photographic Experts Group 2000
j2w - World file for JPEG2000 image
JPEG2000 is an open standard for wavelet compression of images.
- sid - Multi-resolution Seamless Image Database (MrSID)
sdw - World file for MrSID image
This is another proprietary wavelet format, from LizardTech, but ArcGIS provides a built-in viewer.
- tif - Tagged Image Format
tfw - world file for TIF image
This image format is commonly output by cameras and photo enhancement programs. It may or may not be compressed.
ArcGIS will also create the following two formats as adjuncts to raster files, as necessary:
- aux - Raster Auxiliary
Stores projection and other information about any of the above formats.
- rrd - Raster Pyramids
Stores pyramids (lower resolution versions) of an image for faster screen display.
- shp - Shapefile (stores feature geometry)
shx - Shapefile (stores file lookup index)
prj - Shapefile (stores projection definition)
Shapefiles are the basic vector format used by ESRI software, as well as many others because of their ubiquity.
Each shapefile contains exactly one type of vector data (point, line, or polygon).
- sdc - Smart Data Compression
This is a new format that's used to distribute large collections of data in a compressed format.
- cov - Coverage
Coverages are a more sophisticated format used by ESRI software, allowing the grouping of many related objects.
However, they are being phased out in favor of geodatabases (see below).
- dlg - Digital Line Graph file - not a native ArcGIS format.
- dwg - AutoCAD Drawing file
dxf - Drawing exchange file
wld - World file for CAD datasets
- txt - text file - simple text tables can be imported as point features.
- csv - Comma-Separated Values
A text file containing a simple table with each field separated by commas.
- dbf - dBASE tabular data file, also used for Shapefile attribute tables
- mdb - Microsoft Access tabular data file. Also used for the personal Geodatabase.
- tab - tab-separated text file, a simple table with each field separated by a tab.
- lyr - ArcMap Layer
This is pointer to an individual data set that also describes its viewing properties (e.g. its symbology).
- mxd - ArcMap Map Document
Contains pointers to the included data, and how their view is structured (e.g. frame coordinates and symbology).
- pdf - Adobe Acrobat Portable Document Format
This format is designed to be easily printable and shareable, and can even provides control of layer display.
- pmf - Published Map File
This can be created with ArcMap and distributed with the free ArcReader.
- kml - Keyhole Markup Language
This is the format used by the free program Google Earth (formerly called Keyhole). It can be created with ArcMap.
- kmz - Zip-Compressed KML
- Use ArcCatalog to investigate some of the properties of the files in
C:\Maps\makingmaps\. Compare the ArcCatalog view of folders with the Windows Explorer view.
Some data is not in ready-to-use form.
- Use
 A rcToolbox to convert a file in A rcToolbox to convert a file in C:\Maps\findingdata\convert.
|


 Rasters are grids of rows and columns of cells.
 Vectors are geometric shapes, including points, lines, and polygons.
 Both raster and vector files can have tables of data associated with them, e.g. elevation, population, financial values, etc.