Geographic Information Systems (GIS) provide a powerful way to visualize and analyze spatially distributed data.
A Brief Overview of GIS
Numerous applications of GIS can be seen in our own Town
of Amherst.
 Geographic Information Systems (GIS) are a set of computer programs
that can organize, display, and analyze spatially distributed data. Geographic Information Systems (GIS) are a set of computer programs
that can organize, display, and analyze spatially distributed data.
At its simplest, GIS is "mapping", providing a geographic arrangement of extremely diverse information, and allowing for visual comparisons.
Such maps are therefore a powerful means to educate others in class and in publications.
Additional GIS tools can extract related features, provide geostatistical analysis, and generate 3D models and movies of time-dependent changes.
GIS has been applied in geology, biology, psychology, anthropology, sociology, linguistics, history, political science, economics, and many other fields.
- GIS data is commonly in one of two forms:
 Raster:
A grid of rows and columns of cells. Raster:
A grid of rows and columns of cells.
These might represent
photographic or scanned images.
  Vector: A geometric shape, including
points, lines, and polygons. Vector: A geometric shape, including
points, lines, and polygons.
These might represent buildings, roads, and counties.
Either of these can have tables of data associated with them, e.g.
elevation, population, financial values, etc.
Such associated data can be used to color a map so
that it conveys information with visual impact.
- Some samples of GIS-produced maps for the town of Amherst are shown below, clear evidence of its cross-disciplinary value.
| |
Overview Maps |
|
|
| |
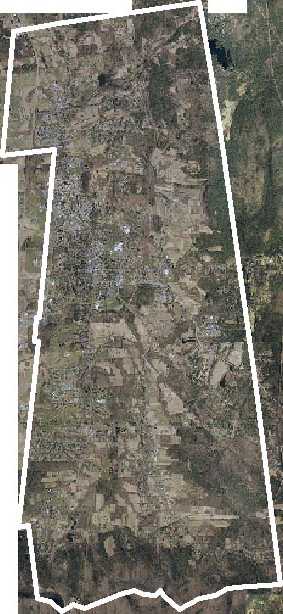
Visible Orthographic Photograph
|
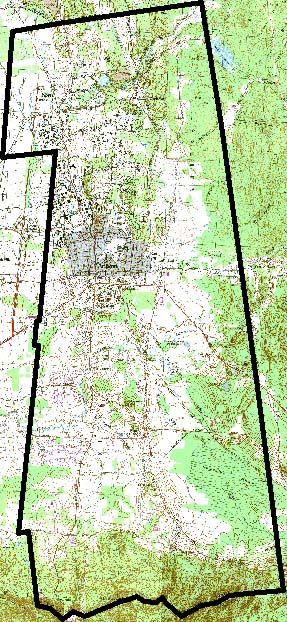
Scanned Map
|
Infrared Orthographic Photograph
|
| |
Amherst's true colors are revealed by this orthophoto (a photo with perspective removed). It's a mosaic of many taken by airplane.
Cell Resolution = 0.152 m = 6 in. |
A scanned USGS topographic map shows streets, buildings, open lands (green), and constant-elevation contours (brown lines).
Cell Resolution = 2.54 m = 8.33 ft = 100 in.
|
A Landsat 7 satellite image shows warmer areas (purple) and cooler areas (green), with streets added for reference (black).
Cell Resolution = 291 m = 955 ft.
|
| |
Type: Raster/Image. |
Type: Raster/Image. |
Type: Raster/Image; Vector/Line. |
| |
|
|
|
| |
Scientific Maps |
|
|
| |
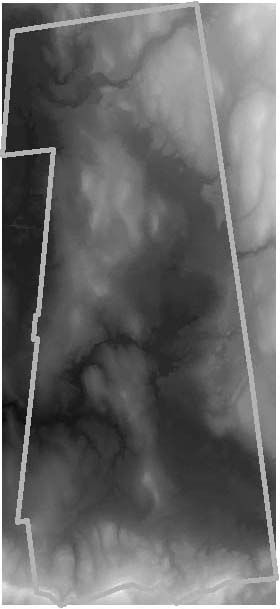
Terrain Elevation (Topography)
|
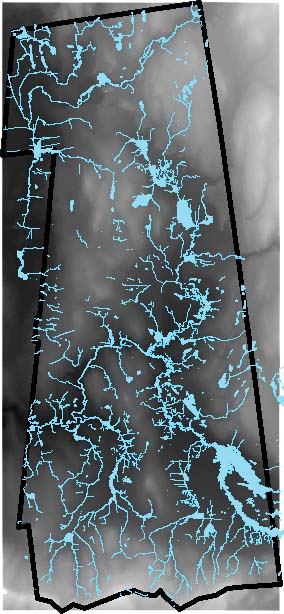
Water Resources (Hydrography)
|
Vegetation
|
| |
This "digital elevation model" (DEM)
gives each pixel a color-coded elevation (black = 90 ft., white = 1302
ft.).
Cell Resolution = 30 m = 98 ft. |
Lakes, reservoirs, and streams in blue,
over the DEM to illustrate relationship to land forms. |
Different types of vegetation, e.g. forest,
grasslands, agricultural, etc. |
| |
Type: Raster/Data. |
Type: Raster/Data; Vector/Line, Polygon. |
Type: Vector/Polygon |
| |
|
|
|
| |
Civil and Political Maps |
|
|
| |
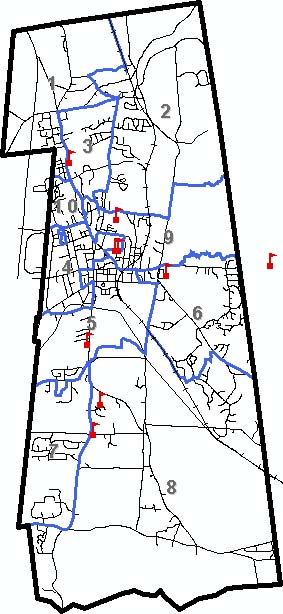
Streets, Precincts, and Schools
|
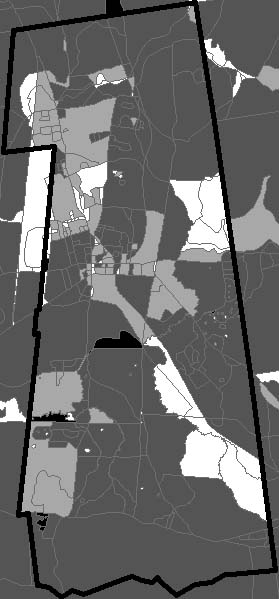
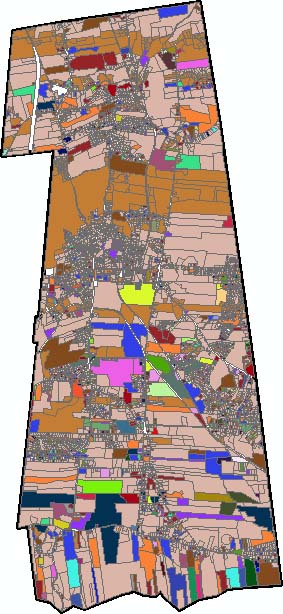
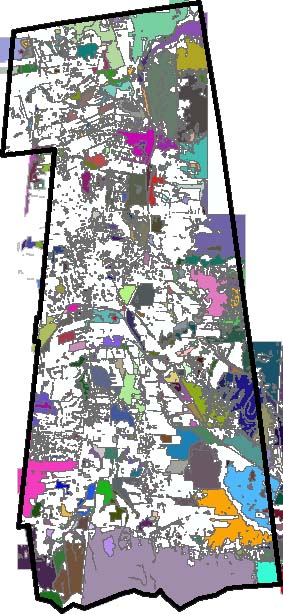
Land Use
|
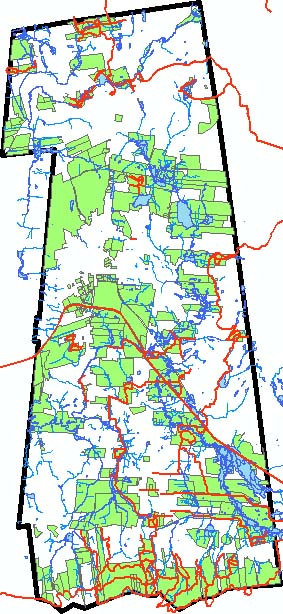
Open Lands and Trails
|
| |
Streets and railroads, precincts (blue), and K-12 schools. |
Different uses of land, e.g. commercial, residential, agricultural, institutional, etc. |
Open lands (green) and trails (red), and again water(blue). |
| |
Type: Vector/Line, Polygon, Point. |
Type: Vector/Polygon. |
Type: Vector/Line, Polygon. |
| |
|
|
|
- Constructing maps using GIS data such as the above is
the subject of the first day of this course.
- The data underlying these maps comes from many sources: the Town
of Amherst, the State of Massachusetts, the U.S. Census Bureau, and
the U.S. Geological Survey.
Often GIS data comes ready-to-use; other
times you must first convert it to a useable format.
Locating and preparing GIS data for use in a map is the subject of
the second day of this course.
- Sometimes you must create GIS data yourself,
e.g. by scanning a paper map or using a Global Positioning System (GPS)
device.
You can also combine GIS data
with the underlying geography to calculate important characteristics
such as population density, income-to-resource relationships, hill
slope, and flooding potential (examples are shown below).
Creating GIS data for use in a map is the subject of the third
day of this course.
|
Calculated Maps |
|
|
| |
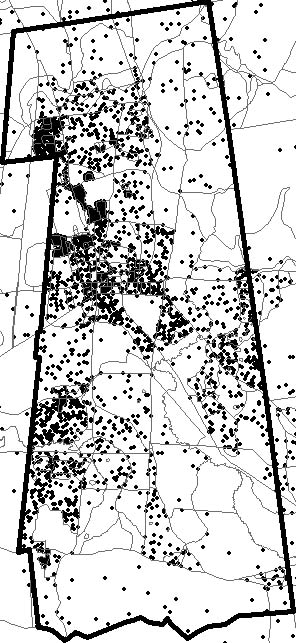
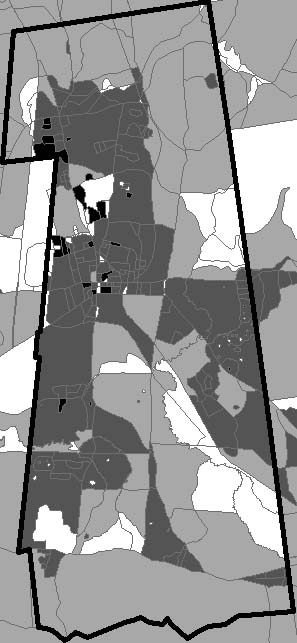
Population Density
|
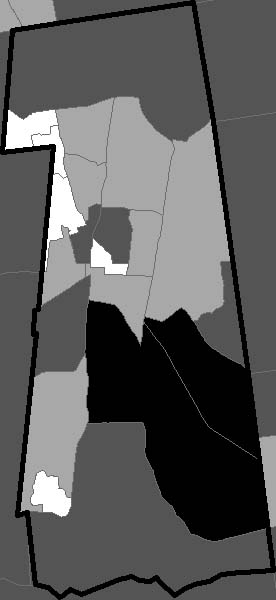
Non-English Principal Language
|
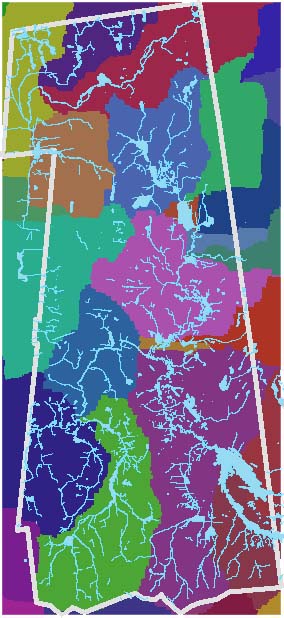
Watersheds
|
| |
 Census
2000 population data, divided by the area of census blocks. Census
2000 population data, divided by the area of census blocks. |
 Census
2000 population whose principal language is not English, relative to
the total population (applied to census block groups). Census
2000 population whose principal language is not English, relative to
the total population (applied to census block groups). |
Analysis of digital elevation model
to determine regions that flow into the same stream (in random colors), with
streams superimposed (light blue). |
| |
Type: Vector/Polygon. |
Type: Vector/Polygon. |
Type: Raster/Data; Vector/Line, Polygon. |
| |
|
|
|
The ArcGIS
Software
The ArcGIS software that Amherst College provides has made
"desktop GIS" a reality.
 Geographic Information Systems have been around for forty
years, but have become increasingly accessible
as computing power has increased. Geographic Information Systems have been around for forty
years, but have become increasingly accessible
as computing power has increased.
- Amherst College has one of the best GIS available, the Arc products from
Environmental Systems Research Institute.
Their newest software, ArcGIS, has made GIS significantly easier than it was even a few years ago.
- ArcGIS consists of three primary programs:
ArcMap: create, view, and manipulate maps (shown).
ArcCatalog: view and organize the various pieces of data that go into making
a map.
ArcToolbox: convert data from one format to another.
- ArcGIS
is available on all Windows computers in the campus
public labs.

There is also a GIS computer classroom where faculty members can teach students about GIS or other subjects applying GIS, and give them a chance to work on projects with the latest hardware and software.
- Faculty
and staff can install ArcGIS on any College-provided Windows computers
from the Software (K:) drive.
Laptop (off-network) installation of ArcGIS requires a
hardware key.
Anyone with a Windows computer can install the free program ArcReader, allowing them to view "published maps" produced by ArcGIS.
- Contact Academic Technology Services for more information or assistance.
Additional
GIS Training and Resources
There are many other options for learning GIS and extending your
knowledge.
- Amherst College's license for the ArcGIS software includes a number of
online courses:
Contact Academic Technology Services for
more information or to obtain a license code.
- Every installation of ArcGIS on campus includes a number of digital books
in Adobe Acrobat (PDF) format, in C:\Program Files\ArcGIS\Digital Books:
| What is ArcGIS |
A brief overview of the various pieces of
software that make up ArcGIS. |
| Getting Started with ArcGIS |
A brief guide to ArcGIS. |
| Using ArcMap |
A brief guide to the ArcMap component of ArcGIS. |
| Using ArcCatalog |
A brief guide to the ArcCatalog component of ArcGIS. |
| Using ArcToolbox |
A brief guide to the ArcToolbox component of ArcGIS. |
| Using ArcReader and ArcGIS Publisher |
A brief guide to the ArcPublisher component of ArcGIS, and the free ArcReader. |
| Editing in ArcMap |
An introduction to editing data in ArcMap. |
| Using ArcGIS Spatial Analyst |
A comprehensive introduction to geographic-based calculations. |
| Using ArcGIS 3D Analyst |
Describes many of the three-dimensional capabilities
of ArcGIS. |
| Building a Geodatabase |
Geodatabases are a new format to collect together the
data underlying maps. |
| Modeling Our World |
An overview of what's involved in accurately mapping
the Earth. |
| Understanding Map Projections |
A more detailed explanation of map projections. |
- The Amherst College Library maintains a web page of GIS
resources, including links
to the GIS books in the library's collection.
- There are a number of tutorials that can be found
on the Internet, some of which are:
ArcGIS Tutorials:
a short tutorial from the East St. Louis Geographic Information Retrieval
System of the East St. Louis Action Research Project.
ArcGIS Introductory Tutorial: a
tutorial from the University of Arkansas that's intended to get you going
quickly with your own data.
|


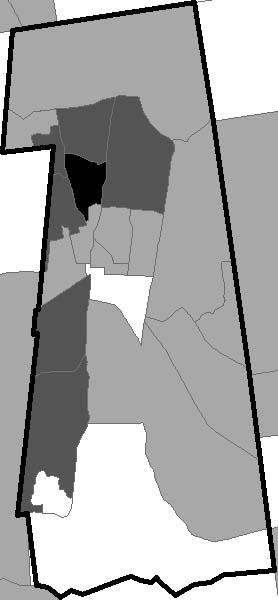
 Census 2000 average age within each census block, grouped into four categories.
 Census 2000 average household income within each census block group, grouped into four categories.