Not all geographic data is in a GIS-ready format. Commonly it is in the form of a table of values assigned to named geographic features such as states, to X-Y spatial coordinates such as is output by GPS receivers, or to street addresses. Traditionally it also comes in pictorial forms such as paper maps, which can be scanned into digital form. In all of these cases the data will need to be geographically aligned in some way.
Since this tutorial will be using specific maps and data, the first step is to make your own copy of the tutorial data.
- In the Windows Explorer, navigate to the network drive
 K: (aka \\Software\Winsoft), open the folder K: (aka \\Software\Winsoft), open the folder  Maps, and then open the folder Introduction to GIS. Maps, and then open the folder Introduction to GIS.
- Drag the folder preparingdata and its contents to either:
- your network drive U:, e.g. into the folder My Documents; or
- the local hard drive
 C:, e.g. onto your Desktop. C:, e.g. onto your Desktop.
Since some — but not all — of the ArcGIS components have trouble handling names with spaces or special symbols, do not rename the folders or files.
- Start up the
 ArcMap software (see Constructing and Sharing Maps for details). ArcMap software (see Constructing and Sharing Maps for details).
- Click on the button
 Add Data. Add Data.
- In the dialog Add Data, navigate into the folder preparingdata; if necessary, make a new connection to it first (see Constructing and Sharing Maps for details).
- In the folder preparingdata, click on the file
 states.shp. states.shp.
- Click on the button Add.
ArcMap will now display the map of the United States that we saw before:
When data is associated with geographically named regions, we can join it to an existing shapefile.
Geographic data ideally comes in the form of a layer, which is a set of geographic features with attributes assigned to them. We've already seen examples of country, state, and county polygons, as well as city points, whose attribute tables associate information such as area, population, etc. with those features. The data files also included information about the shape and position of the features, so they could be immediately displayed as a map, as above:

Very often, however, you may obtain or create a table of data whose only geographic connections are a set of names, e.g. "Massachusetts", "Alabama", etc. In other words, it doesn't have the Shape field, which describes the actual geography:

Fortunately, if you have access to a map layer that defines the same geographic regions with the same names, you can join your table to that layer. Joining essentially extends its attribute table with new fields (columns), which you can then use to symbolize it, etc.
- Navigate into the folder preparingdata.
- Locate the file
 stateinfo.xls, which is a Microsoft Excel workbook, and double-click on it to open it in Excel. stateinfo.xls, which is a Microsoft Excel workbook, and double-click on it to open it in Excel.
- Examine the workbook's structure:
- The simple rectangular arrangement of the data;
- The initial row containing the attribute names;
- Subsequent rows each containing the data of one feature (called a record);
- Each column containing a single attribute as it varies from feature to feature (called a field).
- The worksheet names, e.g.
Dates, in the tabs at the bottom of the window. You can have many worksheets in the same workbook.
- Close the workbook.
As a simple example of joining, we'll use the data shown above:
- the map layer states.shp and its field STATE_NAME, and
- the table
 stateinfo and its field State. stateinfo and its field State.
Any map layer can have a table joined to it, as long as they have a matching attribute:
- In ArcMap, click on the button Add Data.
- In the dialog Add Data, navigate into the folder with the table to be joined, e.g. preparingdata.
- Double-click on the table to be joined, e.g the Excel workbook
 stateinfo.xls. stateinfo.xls.
- In ArcGIS dialogs, workbooks act like folders, displaying as separate "files" its worksheets and named regions (discussed below). Note that the former all have a $ at the end of their names.
If the join table is inside a workbook, add it to your map document by double-clicking on it, e.g. Dates$.
Note that the Table of Contents will now, if necessary, switch to the Source view; the reason is that a table by itself is not displayable on the map, and therefore won't show up in the Display view. You wil probably want to switch back to the latter, though, since its simpler.
- In the Table of Contents, right-click on the layer to be joined, e.g. states.shp.
- The layer's contextual menu will now appear; select the menu item Joins and Relates, followed by the menu item Join....
- In the dialog Join Data, in the menu What do you want to join to this layer?, make sure that Join attributes from a table is selected.
- In the menu 1. Choose the field in this layer that the join will be based on:, select the field STATE_NAME.
- In the menu 2. Choose the table to join to this layer, or load the table from disk:, select the table to be joined, e.g. Dates$.
Note that, if you don't first add the data as in steps 1-4, you can click on the button  Browse and add it here; however this isn't quite as flexible. Browse and add it here; however this isn't quite as flexible.
- In the menu 3. Choose the field in the table to base the join on:, select the field State.
- Click on the button OK.
To see the results of this procedure, try out the new attributes:
- In the Table of Contents, right-click on the layer states.shp and select the menu item
 Open Attribute Table. Open Attribute Table.
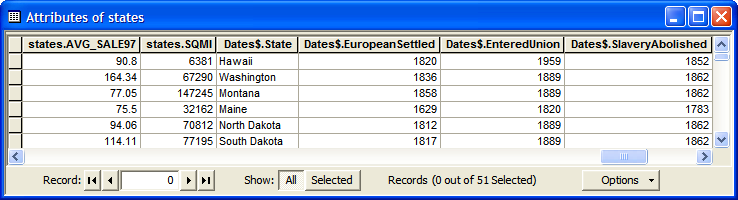
- Examine the workbook's structure: the fields from the first table all begin with states., and after them come the fields from the second table, whose names all begin with Date$.. These prefixes allow you to distinguish between fields that might have the same name in the two tables.
- Close the attribute table.
- Symbolize the layer with one of the quantitative fields from the second layer.
Be aware that the additional fields from the joined table have not been permanently added to the map layer, just temporarily linked to it. This means that if you move the table file to some other location, the map will no longer work because ArcMap will be looking in the wrong place for the file. When this happens the table will have a red question mark ! next to its name in the Table of Contents, and you can click on that to start a dialog to relocate it. This is one of the advantages of adding the table to the map before beginning the join (steps 2-4 before step 5 in Procedure 1 above). If you do it afterward, as mentioned in step 9, you can lose track of it.
As another example of commonly available data that's geographically named, we'll work with some more census data. As you probably already know, every ten years there is a census that tries to get some basic information from 100% of the U.S. population; this is the primary source of the data we looked at previously in the states layer. In addition, the U.S. Census Bureau provides many variations of this data, as well as the results of the annual American Community Survey that tracks detailed information from a small subset of the population. This data is in tables that you must join to existing layers.
We'll also use a type of geographic region that you might not be familiar with, census tracts. According to the Bureau, "Census tracts are small, relatively permanent statistical subdivisions of a county....Designed to be relatively homogeneous units with respect to population characteristics, economic status, and living conditions, census tracts average about 4,000 inhabitants."
Two smaller subdivisions of census tracts are also available, though we won't use them here. Census blocks are "the smallest geographic unit for which the Census Bureau tabulates 100-percent data....Many blocks correspond to individual city blocks bounded by streets, but blocks — especially in rural areas — may include many square miles." Census block groups are just that, and are the smallest region available for some sensitive attributes such as income.
- In ArcMap, click on the button Add Data.
- In the dialog Add Data, navigate into the folder preparingdata; if necessary, make a new connection to it (see Constructing and Sharing Maps for details).
- In the folder preparingdata, click on the file masstracts.shp.
- Click on the button Add.
ArcMap will now display a map of the census tracts in Massachusetts:

If you right-click on the layer masstracts and select the menu item Open Attribute Table, you should see the following:
The census tracts are uniquely named by their FIPS (Federal Information Processing Standards) code, which begins with the two-digit state code, followed by the three-digit county code, and finally the tract code. We can use this identifier to join other census data to this layer.
The Census Bureau lets you download much of their data from their web site. As an example, we'll map some sampled poverty data from the latest census.
- First start up a web browser:
- Click on the menu
 Start. Start.
- Point at the menu item All Programs.
- Locate your preferred web browser,
 Firefox or Firefox or  Internet Explorer, and click on it. Internet Explorer, and click on it.
- In your web browser, visit the web address www.census.gov .
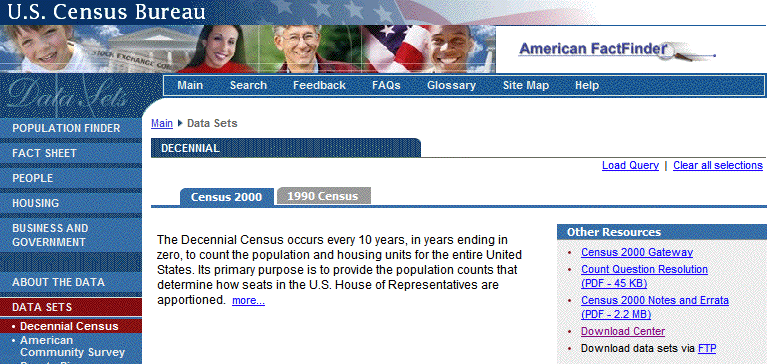
- On the left side of the web page Census Bureau Home Page, click on the link American Factfinder.
The left side of this web page, American Factfinder, has several useful links that let you explore census data on-line. In particular, the link About the Data provides general information about the Census Bureau's data and how it's collected and structured. Two links, Data Sets and Download Center, let you download data immediately, but the former is simpler to use.
- On the left side of the web page American Factfinder, click on the link Data Sets. By default the subpage Decennial Census should be selected, as well as the tab for the most recent year available (in this case Census 2000):
- Further down the web page Decennial Census, in the button group 2000, click on the button Census 2000 Summary File 3 (SF 3) - Sample Data:
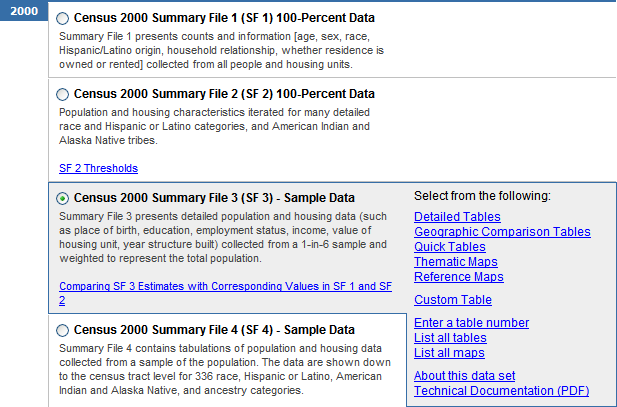
- To the right under the heading Select from the following:, click on the link Detailed Tables.
- In the web page Select Geography, in the list Choose a selection method, the list item list should be selected. In the menu Select a geographic type, choose the menu item Census Tract.
- In the menu Select a state, choose the menu item Massachusetts.
- In the menu Select a county, select the menu item Hampden County.
- In the menu Select one or more geographic areas, select the menu item All Census Tracts.
- Click on the button Add ▼.
- Click on the button Next ▶.
- In the web page Select Tables, in the list Choose a table selection method, click on the list item by subject.
- In the menu Select a subject, under the heading ==== Economic Characteristics ====, choose the menu item .... Poverty (Families and Individuals).
- Click on the button Search.
- In the list Select one or more tables, click on the list item P87. Poverty Status in 1999 by Age.
- Click on the button Add ▼.
- Click on the button Show Result ▶.
- On the web page Detailed Tables, point at the menu Print/Download, and then select the menu item Download.
- On the web page Detailed Tables ▶ Download, in the button group Select download options, under the heading Database compatible (data rows only), click on the button Microsoft Excel (.xls).
The Microsoft Excel file format is used here because this program makes it relatively easy to view and modify data tables. It can also be read directly by ArcGIS (as of version 9.2). Comma-separated values (CSV) is probably the next best format if you don't have Excel.
- Verify that the checkbox Include descriptive data element names is selected, and click on the button OK.
- The data will be downloaded as a single compressed file named output.zip; locate this file, open it, and drag its contents to the folder preparingdata. The ZIP file contains four files; the actual data is in the file dt_dec_2000_sf3_u_data1.xls.
If you need assistance in selecting your data sets of interest, please contact librarian Susan Edwards.
Once you've downloaded this data, double-click on the file dt_dec_2000_sf3_u_data1.xls to open it automatically in  Excel and inspect its contents: Excel and inspect its contents:

You might have noticed that the column labeled GEO_ID2, the second "Geography Identifier", is the same attribute as the FIPS number in the attribute table of the layer masstracts. We may therefore use these two fields to join the tables together. However, we must first make two changes to the file to make it compatible with ArcGIS:
- The descriptive labels in the second row of a Census Excel file are important for understanding the meaning of the attributes. However, they are too complex to be used as column headers by ArcGIS, so we will use the first row instead. Because column headers must be immediately above the data, we will swap the first two rows:
- In the application Excel, click on the row header 1, just to the left of the column header
GEO_ID.
- Select the menu Edit, and then click on the menu item Cut.
- Click on the row header 3.
- Select the menu Insert, and then click on the menu item Cut Cells. This should put the column header
GEO_ID into the cell A2.
- Because we are retaining the descriptive labels in the worksheet, there will be non-table data present. We must therefore name the region of cells covered by the table, and use that name when joining, instead of the worksheet name (here called Sheet0).
- Click and hold on the cell in the first row and first column of the table, the cell A2 containing the column header
GEO_ID.
- Select the entire table by dragging down and to the right, until you reach the cell in the last row and column of the table.
- Click in the Name Box that's located above column A, type a descriptive name, e.g.
Poverty, and press the key Enter. Note that spaces, numbers, and most special characters aren't allowed in these names.
Named cell references are known everywhere inside a workbook, including within other worksheets. Names can be added and deleted by selecting the menu Insert, followed by the submenu Name, and then clicking on the menu item Define....
- Select the menu File, and then click on the menu item Save.
To see the results of this procedure, try out the new attributes:
- Follow Procedure 1 and join the census table dt_dec_2000_sf3_u_data1.xls to the layer masstracts using the fields
GEO_ID2 and FIPS, respectively.
- Symbolize the layer with one of the quantitative fields from the second layer, e.g.
P087002 (Population for whom poverty status is determined: Income in 1999 below poverty level), normalized by P087001 (Population for whom poverty status is determined: Total).

Before joining two tables using a particular attribute, it's generally a good idea to ascertain the data type of that attribute in the layer's table. The reason is that not only the join attribute's values but also its type must be compatible in the two tables, and appearances can be deceiving. For example, the POP2000 number in the attribute table for masstracts may appear to be an integer but it could actually be text or a real number.
The following table describes the most common data types.
Some Common ArcGIS Attribute Data Types
| Data Type |
Value Represented |
Minimum Value |
Maximum Value |
Maximum Significant Digits/Characters |
| Short |
Integer number |
-32,768
|
32,767
|
5
|
| Long |
Integer number |
-2,147,483,648
|
2,147,483,647
|
10
|
| Float |
Real number |
-3.4 x 1038
|
1.2 x 1038
|
6
|
| Double |
Real number |
-2.2 x 10308
|
1.8 x 10308
|
15
|
| Text |
String of characters |
—
|
—
|
254
|
- In ArcMap, in the Table of Contents, double-click on the layer of interest, e.g. masstracts.
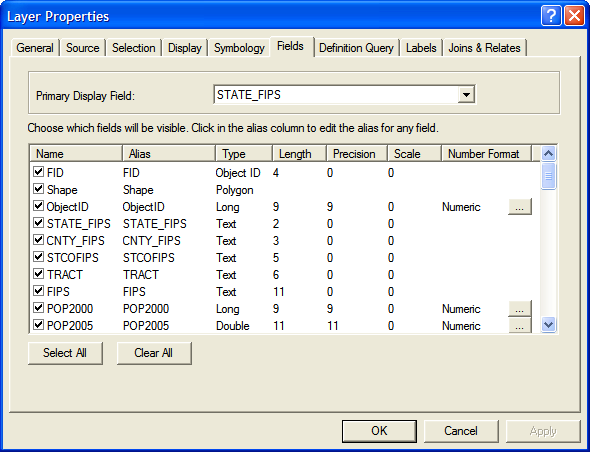
- In the dialog Layer Properties, click on the tab Fields.
- In the list of fields, scroll down until you find the attribute name you are interested in joining, and note its type.
We can see in the adjacent image that the data type of the FIPS attribute in masstracts is Text.
Question: Could it be another type?
To use this attribute to join an Excel table, the corresponding attribute data type must also be Text. If you look at this Excel table and the join field we used, GEO_ID2, you'll note the little green flag in the upper left corner of each cell; it indicates that the numbers are actually formatted as text.
- In the application Excel, click on the column header of the data whose format you want to change, e.g. A (you can also click and drag over specific cells in that column to select them).
- Select the menu Format, and then click on the menu item Cells....
- In the dialog Format Cells, click on the tab Number.
- In the list Category, you can choose a numbe of different formats:
- If you want the data to be treated as text, select Text.
- If you want the data to be treated as integers, select Number, and then change the number of Decimal Places: to 0.
- If you want the data to be treated as real numbers, select Number, and then change the number of Decimal Places: to a value that matches the data in the map layer's join attribute. Note: because of rounding errors, joining real data should be avoided.
- Click on the button OK.
- In the menu File, select Save.
Another formatting incompatibility to be aware of is that the content of a cell in the Excel join column cannot wrap, i.e. it must all be on one line, and cells in the table shouldn't be merged cells, either.
- In the application Excel, click on the column header of the data whose format you want to change, e.g. A (you can also click and drag over specific cells in that column to select them).
- Select the menu Format, and then click on the menu item Cells....
- In the dialog Format Cells, click on the tab Alignment.
- In the section Text Control, if necessary turn off the checkbox Wrap Text.
- Also, if necessary, turn off the checkbox Merge Cells. Note: this may produce empty cells that misalign your data, so some clean-up may be necessary.
- Click on the button OK.
- In the menu File, select Save.
More generally, the data in the two join columns must match exactly. In particular, watch out for extra spaces between words and at the beginning and end of data.
Summary: Making an Excel File Compatible with ArcGIS
While Microsoft Excel can make it easy to manipulate data tables, it also has its own way of doing things with which you'll need to be familiar to make extensive use of it. Such use is outside of the scope of this class, but if you follow the recommendations below, your data tables should be compatible with ArcGIS.
Generally speaking there are four things you need to do to make Excel data compatible with ArcGIS: create a row of field names, below that arrange your data in a plain rectangular array, name the table, and make sure the join fields match. Below are general descriptions of how to do this.
- Create a row of field names:
- The very first row in a table must contain unique names for each column. Usually they will in some way describe the attribute that will be in that field, e.g. population, zip code, etc.
- Field names must begin with letters, and after that can contain letters, numbers, or the underscore _ . They cannot contain other special characters such as the hypen - or the ampersand &, or spaces (and be careful that you don't have any spaces at the beginning or end of the names, too!). It's also advisable that names be relatively short.
- Arrange your data in a plain rectangular array:
- Every map feature, such as a state or city, must have its data in a single row.
- Every column/field should contain the same kind of information for each feature, e.g. all population values should be in a single column. Blanks are allowed if particular data is missing. Also make sure the values have a consistent data type, e.g. all text, all integers, or all real numbers.
- All record and feature data must be contiguous, i.e. there must be no other data or blank rows or columns separating the data, and it must begin immediately below the field name row.
- Name the table:
- If you have non-table data in the cells around your table, e.g. explanatory notes, you'll want to select just the range of cells covered by the table and give it a unique name.
- If you don't have any other data in the worksheet besides your table, and it begins in cell A1, then the table can be referenced by its worksheet name. It's highly recommended that you change the worksheet name to something more illuminating than
Sheet0. Whatever name it has, ArcGIS will see it with a $ at the end, e.g. Sheet0$, indicating that it's using the entire contents of the worksheet.
- Unlike field names, worksheet and cell range names have few restrictions like those described in (1)(b) above. However, names with spaces and special characters in them will appear with single quotes around them, e.g. 'My Sheet$'.
- Make sure the join fields match:
- Make sure the data types in the join fields are compatible: both text, both integers, or both real numbers.
- Make sure the Excel join field doesn't wrap its text and doesn't have any merged cells.
- Make sure the values in the two join fields match exactly, e.g. there are no extra spaces, variations in case, etc.
- The two tables don't need to have the same number of records, e.g. some features could be missing in one table or the other. If the map layer is missing a record that appears in the join table, the latter will be ignored, and if the join table is missing a record that appears in the map layer, its values will appear as
<Null>.
|