Grading with Blackboard and Excel
Calculating Grades with Excel
|
|
When grades are described numerically, Excel provides a plethora of means to view their characteristics
and modify them.
Grade Statistics
A common desire within gradebooks is to see simple statistics of grades.
- A final grade is commonly determined by a weighted average or mean of test
grades, etc.:
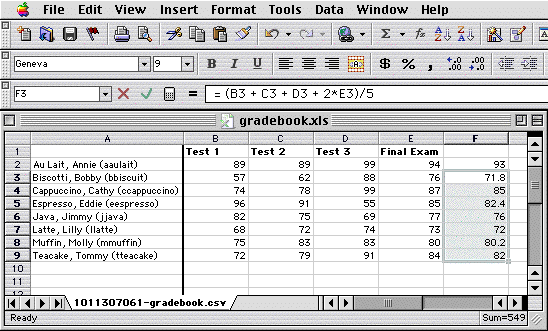
- Here each test counts 1/5 or 20%, while the final exam is counted twice
(2/5 or 40%).
- Instead of the above, you could also use the Average function:
= Average(B2:E2, E2)
One characteristic of the Average function is that it ignores cells that are
blank, distinguishing them from a cell whose data is zero.
Often one may leave a cell blank for a student that hasn't taken a test, but
when calculating you want it to count as zero.
An explicit sum and divide, as above, is therefore preferred in this case.
- Another way one might calculate final grades is with a root-mean-square:
= Sqrt((B2^2 + C2^2 + D2^2 + 2 * E2^2)/5)
This would automatically give more emphasis to the higher grades a student
earns.
While Blackboard's gradebook can provide weighted averages, this root-mean-square
method requires something like Excel.
- Other possible calculations might include quiz grades, extra credit, etc.,
possibly in a nonlinear fashion (e.g. having more weight for lower test scores).
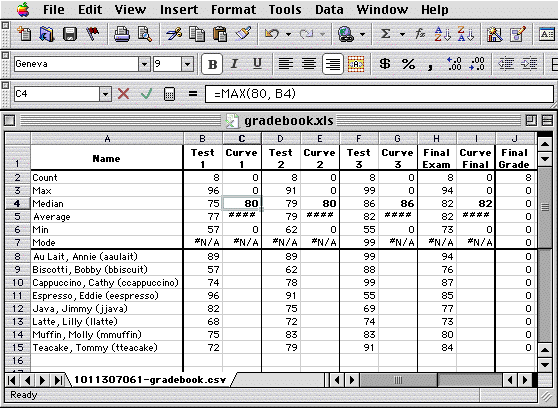
- Many Excel statistical functions could be made a standard part of your gradebook
(another advantage over Blackboard):
- Count: Counts the number of nonempty cells in its argument list.
- Max: Finds the maximum value within its arguments.
- Min: Finds the minimum value within its arguments.
- Median: Finds the value for which half of its arguments are greater
and half are lesser in value.
- Mode: Finds the most common value within its argument
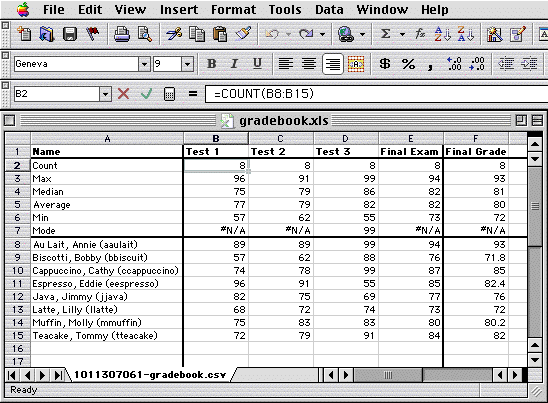
Note that Excel displays the symbol #N/A when it can't calculate an answer (for
Mode there must be one value that's more common than the others, which is less
likely in a small population such as the above).
- The numerical calculations above are typically not integers; they appear
as such because the cells were given a representation
with zero decimal places.
Occasionally one may want to actually round off the result, e.g. if a grade
is given out to students as an integer but subsequently used in another calculation
that the student might verify.
Then the Round function might be used:
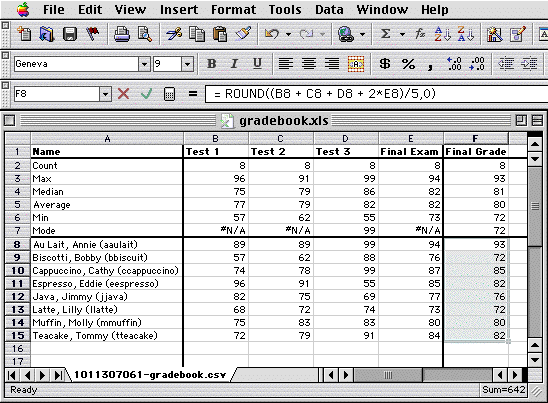
The second argument (0 in this case) describes the number of decimal places
to round off to.
Curving Grades
If you choose to curves grades, any numerical method can be implemented in
Excel.
- The general idea behind curving is to add points to raw grades to bring
them up to a predefined scale of values, consistent across several tests or
other assessments.
One common scale makes a grade in the 90s an "A", in the 80s a "B",
in the 70s a "C", in the 60s a "D", and anything less
an "F".
One might then curve every test to have a median of 80 (for example), and
combine the results for the final grade.
(The median is generally used instead of the average, because in a smaller
class the latter can change significantly if there is a particularly bad or
good grade.)
- Several methods of curving are shown below, for test scores that have a
median of 70:
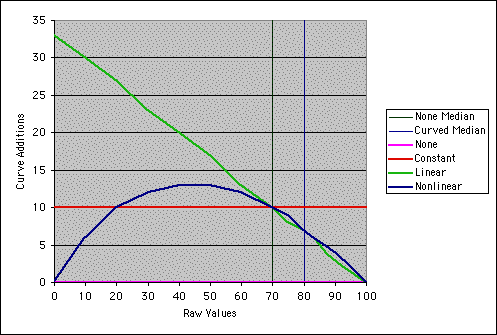
The medians in each case are represented by the vertical lines.
- For each curving method those at the median are given just enough additional
points to remain at the median, and those above or below may be given more
or less points.
If the median of the raw grades is greater than the targeted median of 80
for the curve, a curve will usually subtract points for many students.
If one may wishes to avoid this, one could instead set the curve median to:
Median(C) = Max(80, Median(T))
- One can then set up additional columns in your spreadsheet to calculate
the curves:
The median value of the curve is predetermined, and this is indicated by putting
it in bold.
Let's now consider several possible ways to curve grades.
- For a constant curve, in which everyone gets
the same amount of additional points,
C = T + (Median(C) - Median(T))
With the addition of the Round function, this expression
looks like the following in Excel:
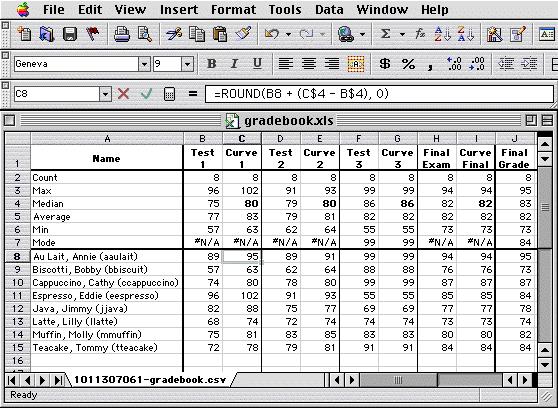
This gradebook can be downloaded here.
- Note the references to the test and curve medians in the formula field,
B$4 and C$4.
Because the median is the same for all of the grades, we don't want Excel
to update that reference when the curve formula is iterated to other cells.
The $ symbol in front of the "4" prevents updating that row reference.
Note that the column references "B" and "C" could still
be updated, as we would want them to be when the formula is copied to the
other curve columns.
- One characteristic of a constant curve is that it can sometimes push the
highest scores over 100, as in cell C11 above.
In this case, one might wish to use a linear curve that fixes the maximum
at Max(C) = 100:
C = (Max(C) - Median(C))/(Max(T) - Median(T)) * (T - Median(T)) + Median(C)
This expression ensures that if T = Max(T), then C = Max(C).
As always, if T = Median(T), then C = Median(C).
In some cases, specifically if Max(T) is increased by more than Median(T),
this function may lower student grades that are below the median.
Therefore, you may wish to limit the additional points added above the median:
Max(C) = Min(100, Max(T) + (Median(C) - Median(T)))
With this restriction, the curve will automatically become constant when necessary.
With the addition of the Round
function, it looks like this in Excel:
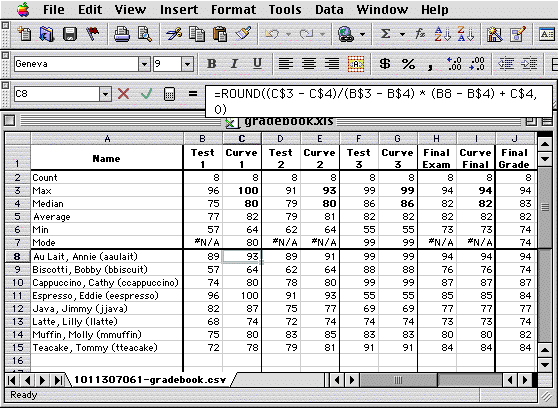
This gradebook can be downloaded here.
- As observed in the graph above, a linear
curve can sometimes give lots of extra points to lower grades.
If you don't want this, you may want to try the nonlinear curve displayed
in the graph:
C = T*Median(C)*(Max(T) - Median(T))/
(T*(Median(C)*Max(T)/Max(C) - Median(T))
+ (1 - Median(C)/Max(C))*Max(T)*Median(T))
(This curve function comes from the American Journal of Physics circa 1972.)
Note that the curve automatically gives zero points to those who don't take
the test.
With the addition of the Round
function, it looks like this in Excel:
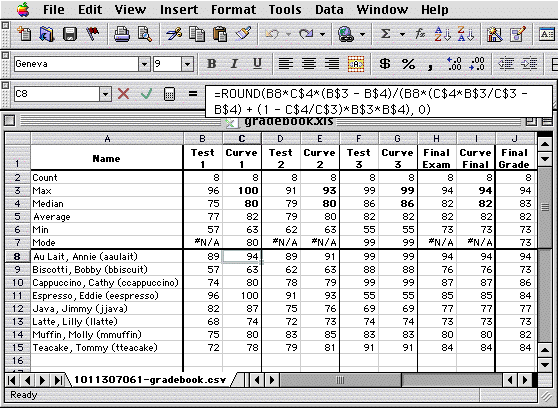
This gradebook can be downloaded here.
Correlations between Grades
Student results can be compared from test to test using Excel's correlation function.
- One reason to curve tests individually (as opposed to one big curve at the
end) is that it makes it easier to compare performance from test to test.
Even if one doesn't choose to curve, the function Correl allows one to compare
two sets of grades by calculating a statistical correlation:
= Correl(Test1, Test2)
This function is based on deviations from the average, so it doesn't require
a common scale.
Correl looks like this in Excel:
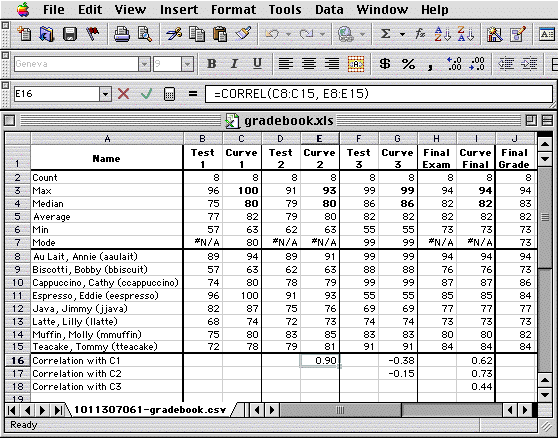
A positive correlation close to 1 indicates the test scores, as a group, are
very close together.
If the correlation is negative, it indicates a flip-flop between the good
students and the bad students.
If the correlation is zero, it indicates an apparently random relationship.
Getting Grades Back into Blackboard
At this point grades might be entered back into Blackboard.
- Eventually the grades must be entered back into Blackboard so that students
can see them.
Excel can export its gradebook to a Blackboard-compatible format called "CSV" ("Comma-Separated Values").
Blackboard can import from CSV files on a column-by-column basis.
See the Blackboard tip Exchanging Grades with Microsoft Excel for detailed instructions.
The fundamentals of graphing the calculations described here can be found in
Graphing with Excel.
|