Geographic Information Systems (GIS) provide a powerful way to visualize and analyze spatially distributed data.
A Brief Overview of GIS
Numerous applications of GIS can be seen in our own Town
of Amherst.
 Geographic
Information Systems (GIS) are a set of computer
programs that can organize, display, and
analyze spatially distributed data. Geographic
Information Systems (GIS) are a set of computer
programs that can organize, display, and
analyze spatially distributed data.
At its simplest, GIS is "mapping",
providing a geographic arrangement of diverse
information, allowing for visual comparison.
Such maps
are therefore a powerful means to educate,
in class and in publications.
Additional
GIS tools can extract related features, provide
geostatistical analysis, and generate 3D
models and movies of time-dependent changes.
GIS has been
applied in geology, biology, psychology,
anthropology, sociology, linguistics, history,
political science, economics, and many other
fields.
GIS data is commonly in one of two forms:
 Raster:
A grid of rows and columns of colored cells. Raster:
A grid of rows and columns of colored cells.
These might represent
photographic or scanned images.
 Vector:
A geometric shape, including points, lines, and polygons. Vector:
A geometric shape, including points, lines, and polygons.
These might represent
buildings, roads, and counties.
 Either of these can have
tables of data associated with them, e.g. elevation,
population, financial values, etc. Either of these can have
tables of data associated with them, e.g. elevation,
population, financial values, etc.
These associated data
can be used to color a map so that it conveys information
with visual impact.
Some samples of GIS-produced maps for the town of Amherst
are shown below, clear evidence of its cross-disciplinary
value.
The data underlying these maps comes from many sources:
the Town of Amherst, the State of Massachusetts, the
U.S. Census Bureau, and the U.S. Geological Survey.
Overview Maps |
|
|
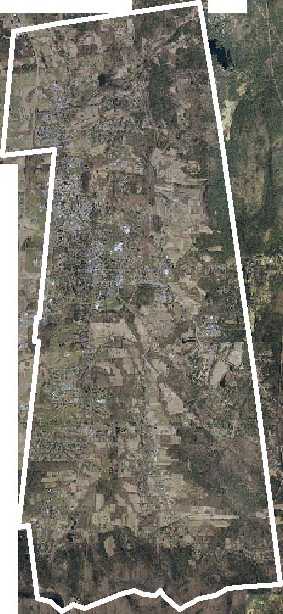
Visible Orthographic Photograph |
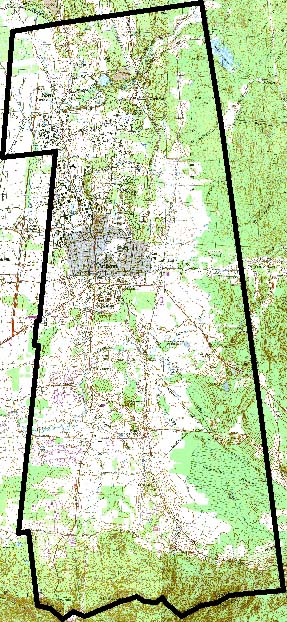
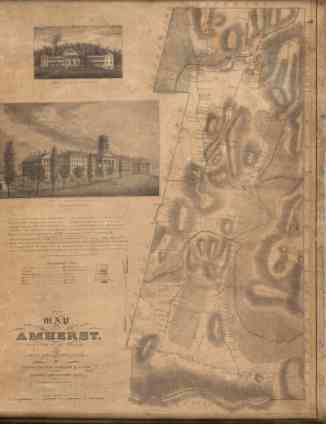
Scanned Map |
Infrared Orthographic Photograph |
Amherst's true colors are revealed by this orthophoto (a photo with perspective removed). It's a mosaic of many taken by airplane.
Cell Resolution = 0.152 m = 6 in. |
A scanned USGS topographic map shows streets, buildings, open lands (green), and constant-elevation contours (brown lines).
Cell Resolution = 2.54 m = 8.33 ft = 100 in. |
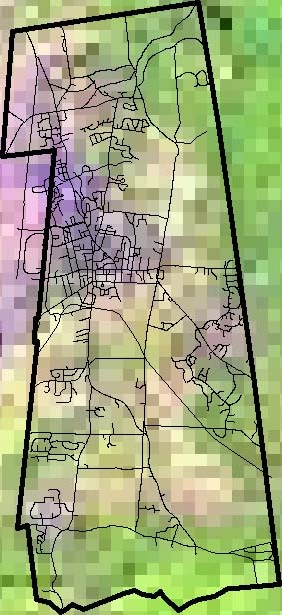
A Landsat 7 satellite image shows warmer areas (purple) and cooler areas (green), with streets added for reference (black).
Cell Resolution = 291 m = 955 ft. |
| Type: Raster/Image. |
Type: Raster/Image. |
Type: Raster/Image; Vector/Line. |
 |
 |
 |
Scientific Maps |
|
|
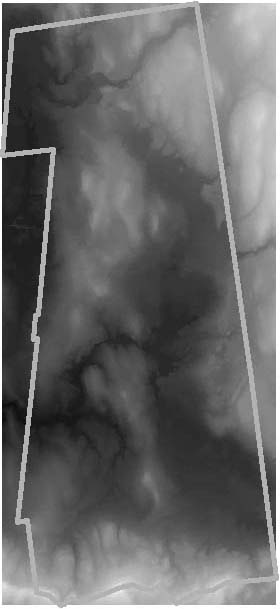
Terrain Elevation (Topography) |
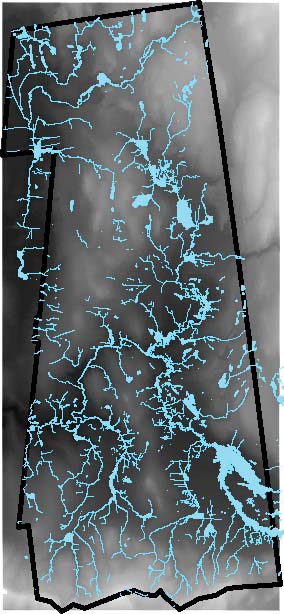
Water Resources (Hydrography) |
Vegetation |
This "digital elevation model" (DEM)
gives each pixel a color-coded elevation (black = 90 ft., white = 1302
ft.).
Cell Resolution = 30 m = 98 ft. |
Lakes, reservoirs, and streams in blue,
over the DEM to illustrate relationship to land forms. |
Different types of vegetation, e.g. forest,
grasslands, agricultural, etc. |
| Type: Raster/Data. |
Type: Raster/Data; Vector/Line, Polygon. |
Type: Vector/Polygon |
 |
 |
 |
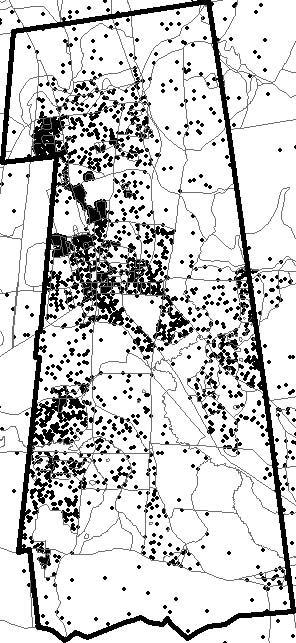
Demographic Maps |
|
|
Population |
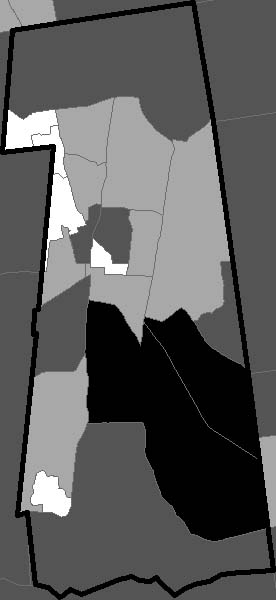
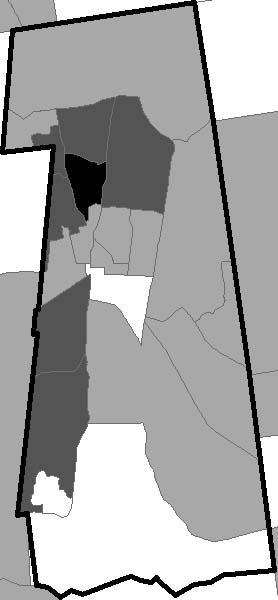
Age |
Income |
| Census 2000 population. Each dot represents 10 people (distributed randomly within census blocks, also shown). |
 Census 2000 average age within each census block, grouped into four categories. Census 2000 average age within each census block, grouped into four categories. |
 Census 2000 average household income within each census block group, grouped into four categories. Census 2000 average household income within each census block group, grouped into four categories. |
| Type: Vector/Polygon. |
Type: Vector/Polygon. |
Type: Vector/Polygon. |
 |
 |
 |
Civil and Political Maps |
|
|
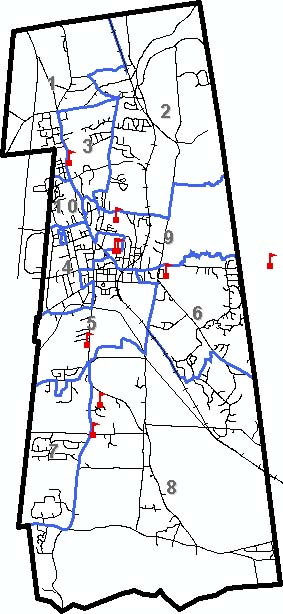
Streets, Precincts, and Schools |
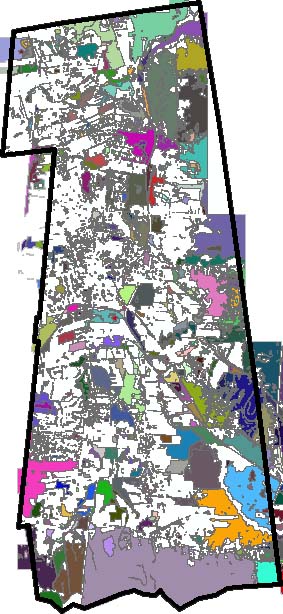
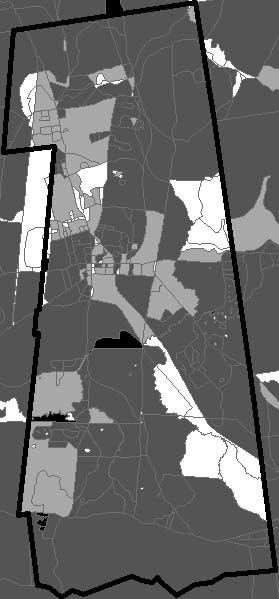
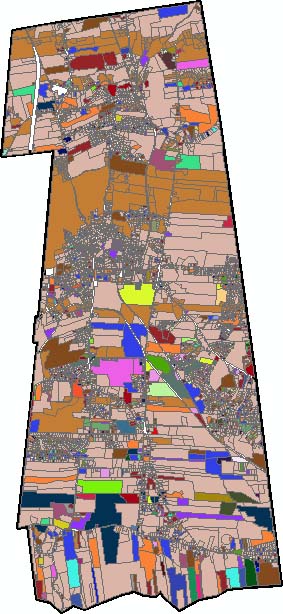
Land Use |
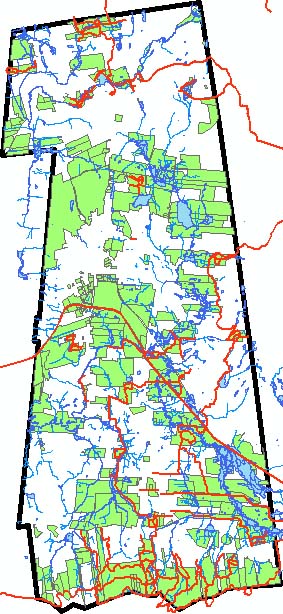
Open Lands and Trails |
| Streets and railroads, voting precincts (blue), and K-12 schools. |
Different uses of land, e.g. commercial, residential, agricultural, institutional, etc. |
Open lands (green) and trails (red), and again water(blue). |
| Type: Vector/Line, Polygon, Point. |
Type: Vector/Polygon. |
Type: Vector/Line, Polygon. |
 |
 |
 |
Calculated Maps |
|
|
Non-English Principal Language |
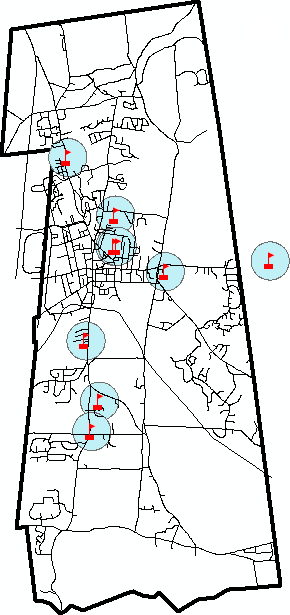
School Buffer Zones |
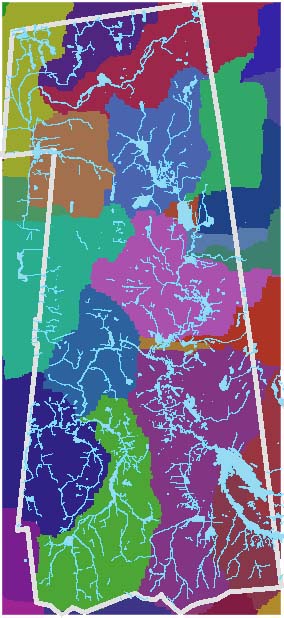
Watersheds |
 Census
2000 population whose principal language is not English, normalized
by the total population (applied to census block groups). Census
2000 population whose principal language is not English, normalized
by the total population (applied to census block groups). |
Schools surrounded by 1500-ft. buffer zones. |
Analysis of digital elevation model to determine
regions that flow into the same stream (in random colors),
with streams superimposed (light blue). |
| Type: Vector/Polygon. |
Type: Vector/Line, Polygon, Point. |
Type: Raster/Data; Vector/Line, Polygon. |
 |
 |
 |
Course Overview
Because of its diverse applications and multiple data
types, learning GIS can take several classes.
You will learn to construct maps using GIS data such as the
above.
You will discover how to use GIS for exploratory analysis of geographic
data.
You will also learn how to export your maps into
a number of formats such as PDF or Google Earth, so that it can be
shared with others who don't have this GIS software.
The
data has been prepared (geographically referenced) in advance
so that you can focus on the general skills required to work
with it.
Often geographic data is not ready-to-use, and in
subsequent classes you learn how to use these different formats.
You will learn to map data from tables that use names for geographic
locations.
This includes census data and street address data.
In these simple
tables, information about each geographic region is in a single row,
viz. its name and attribute data.
This type of data can be geographically
referenced by associating it with existing prepared data.
You will learn about geographic spatial references and how the
globe is projected onto flat maps on computer screens and paper.
In
the process you'll learn to map another common tabular format for
geographic data that uses X-Y coordinates such as latitude and longitude.
The
data collected by a Global Positioning
System (GPS) receiver is in this format.
This type of data
can be geographically referenced by associating it with descriptions
of its spatial reference (i.e. how its coordinate system is oriented
in space).
 Fourth
Class: Working with Traditional Maps Fourth
Class: Working with Traditional Maps
You will learn how to georeference scanned paper
maps, and extract their features into vector layers.
There is still
a lot of information in the world that already comes in the form
of maps.
If you want to compare it with other sets of data, you can
bring it into a GIS so that they can be overlayed.
You can also extract
information from the map using editing tools to create new GIS data.
There are many different ways that GIS
can be used in academic pursuits.
As seen in the previous section, there is a wide variety of
data that can be used to build your own maps.
Finding this data and pulling it together in a usable format
is typically the largest effort involved in GIS.
For example, data from the Third World or precise historical
data can be difficult to come by.
As a result, the most effective academic uses of GIS are:
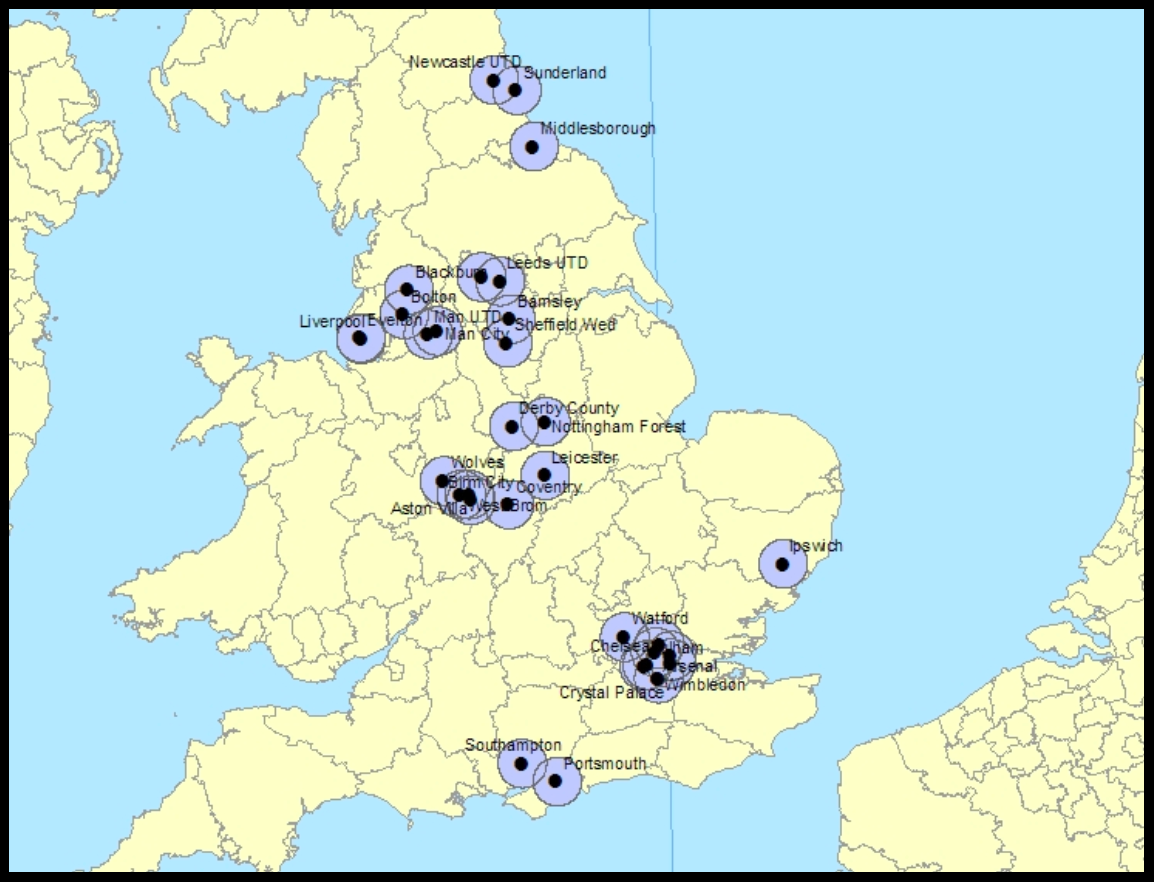
- Faculty research and student thesis projects that are
longer term and so may include the development of original
data or the pursuit of uncertain data sources.
(An Economics
thesis project utilizing British census data is shown
below left.)
- A "term map" where students learn to build
their own maps over a semester (though it's better if
data is identified in advance).
- Simple classroom activities that are prepared in advance
for students, to allow them to explore an issue with geographic
foundations (often these can be prepared with ArcGIS and
then deployed with the free ArcReader or the more familiar
Google Earth software).
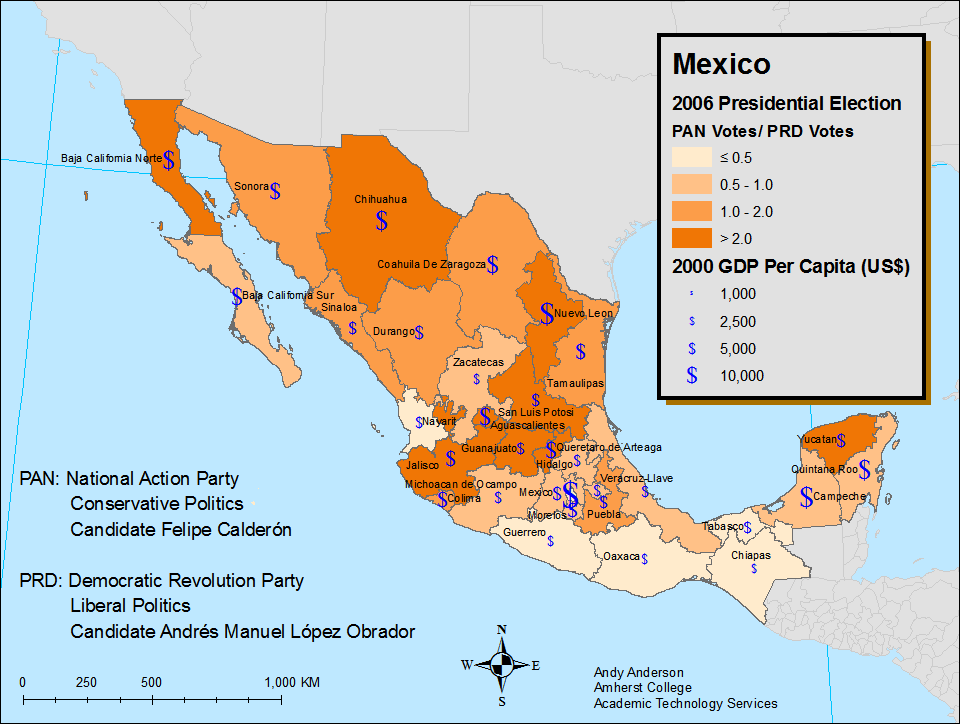
- Maps created to illustrate important ideas that are provided
to students in lectures or handouts or on-line.
(For example a map that illustrates the economic and political
alignments in the 2006 Mexican presidential election, shown
below right.)
The Reference
Librarians will be of great assistance in obtaining
existing data, and Academic Technology Services can assist
you in all of these activities.
The ArcGIS
Software
The ArcGIS software that Amherst College provides has made
"desktop GIS" a reality.
 Geographic
Information Systems have been around for more than forty
years, but have become increasingly accessible
as computing power has increased. Geographic
Information Systems have been around for more than forty
years, but have become increasingly accessible
as computing power has increased.
Amherst College has one of the best GIS available, the Arc
products from
Environmental Systems Research Institute.
Their newest software, ArcGIS, has made GIS significantly
easier than it was even a few years ago.
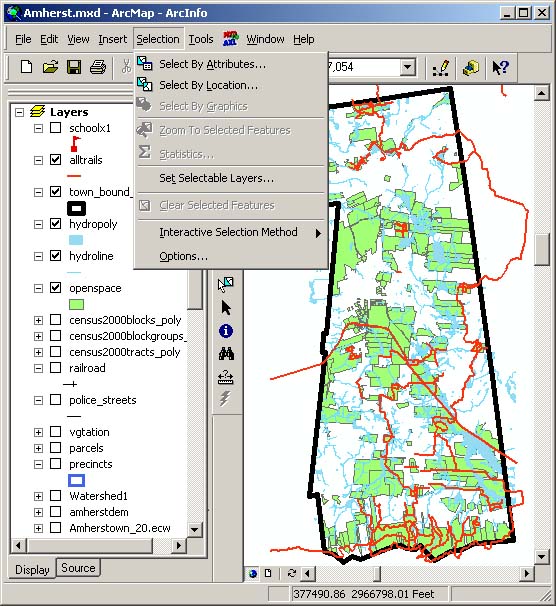
ArcGIS consists of three primary programs:
- ArcMap: create, view, and manipulate maps (shown).
- ArcCatalog: view and organize the various pieces
of data that go into making a map.
- ArcToolbox: convert data from one format to
another and perform many types of geographic analyses.
There are also a large number of extensions, for example for
spatial or three-dimensional analysis.
Anyone with a Windows computer can install the free program
ArcReader (available from the Software
(K:) drive),
allowing them to view "published
maps" produced
by ArcGIS.
 ArcGIS
is available on all Windows computers in most campus
computer labs, as well as on classroom
projection computers. ArcGIS
is available on all Windows computers in most campus
computer labs, as well as on classroom
projection computers.
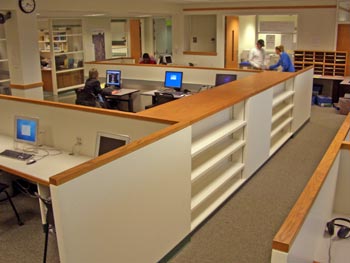
In particular, there is a GIS
computer classroom where
faculty members can teach students about GIS or other subjects
applying GIS, and give them a chance to work on projects with
the latest hardware and software.
Faculty
and staff can install ArcGIS on any College-provided Windows
computer, from the Software
(K:) drive.
Laptop (off-network) installation of ArcGIS requires a
hardware key.
Free one-year licenses are also available for students taking
GIS-related courses or programs; visit this
ESRI web site for more information.
Contact Academic Technology Services for
more information or assistance.
There are many other options for learning GIS and extending your knowledge.
Amherst College maintains a collection of ArcGIS documentation
in the form of Adobe Acrobat
(PDF) digital books, on the network at
K:\Maps\ArcGIS Books-n-Data\Documentation\ESRI Library
including:
| What is ArcGIS |
A brief overview of the various pieces of
software that make up ArcGIS. |
| Getting Started with ArcGIS |
A brief guide to ArcGIS. |
| Using ArcMap |
A brief guide to the ArcMap component of ArcGIS. |
| Using ArcCatalog |
A brief guide to the ArcCatalog component of ArcGIS. |
| Using Publisher |
A brief guide to the ArcPublisher component of ArcGIS, and the free ArcReader. |
| Editing in ArcMap |
An introduction to editing data in ArcMap. |
| Using Spatial Analyst |
A comprehensive introduction to geographic-based calculations. |
| Using 3D Analyst |
Describes many of the three-dimensional capabilities
of ArcGIS. |
| Building a Geodatabase |
Geodatabases are a new format to collect together the
data underlying maps. |
| Maplex for ArcGIS |
An extension that provides better handling
of labels. |
| Understanding Map Projections |
A more detailed explanation of map projections. |
The K:\Maps folder also contains a great deal of data
that can be used as the foundation for your own maps.
The Amherst College Library maintains a web page of GIS
resources, including links
to the GIS books in the library's collection.
There are a number of tutorials that can be found
on the Internet, some of which are:
ESRI also provides a useful collection of tips
and shortcuts for the Arc software.
|

 Second Class:
  Third Class: